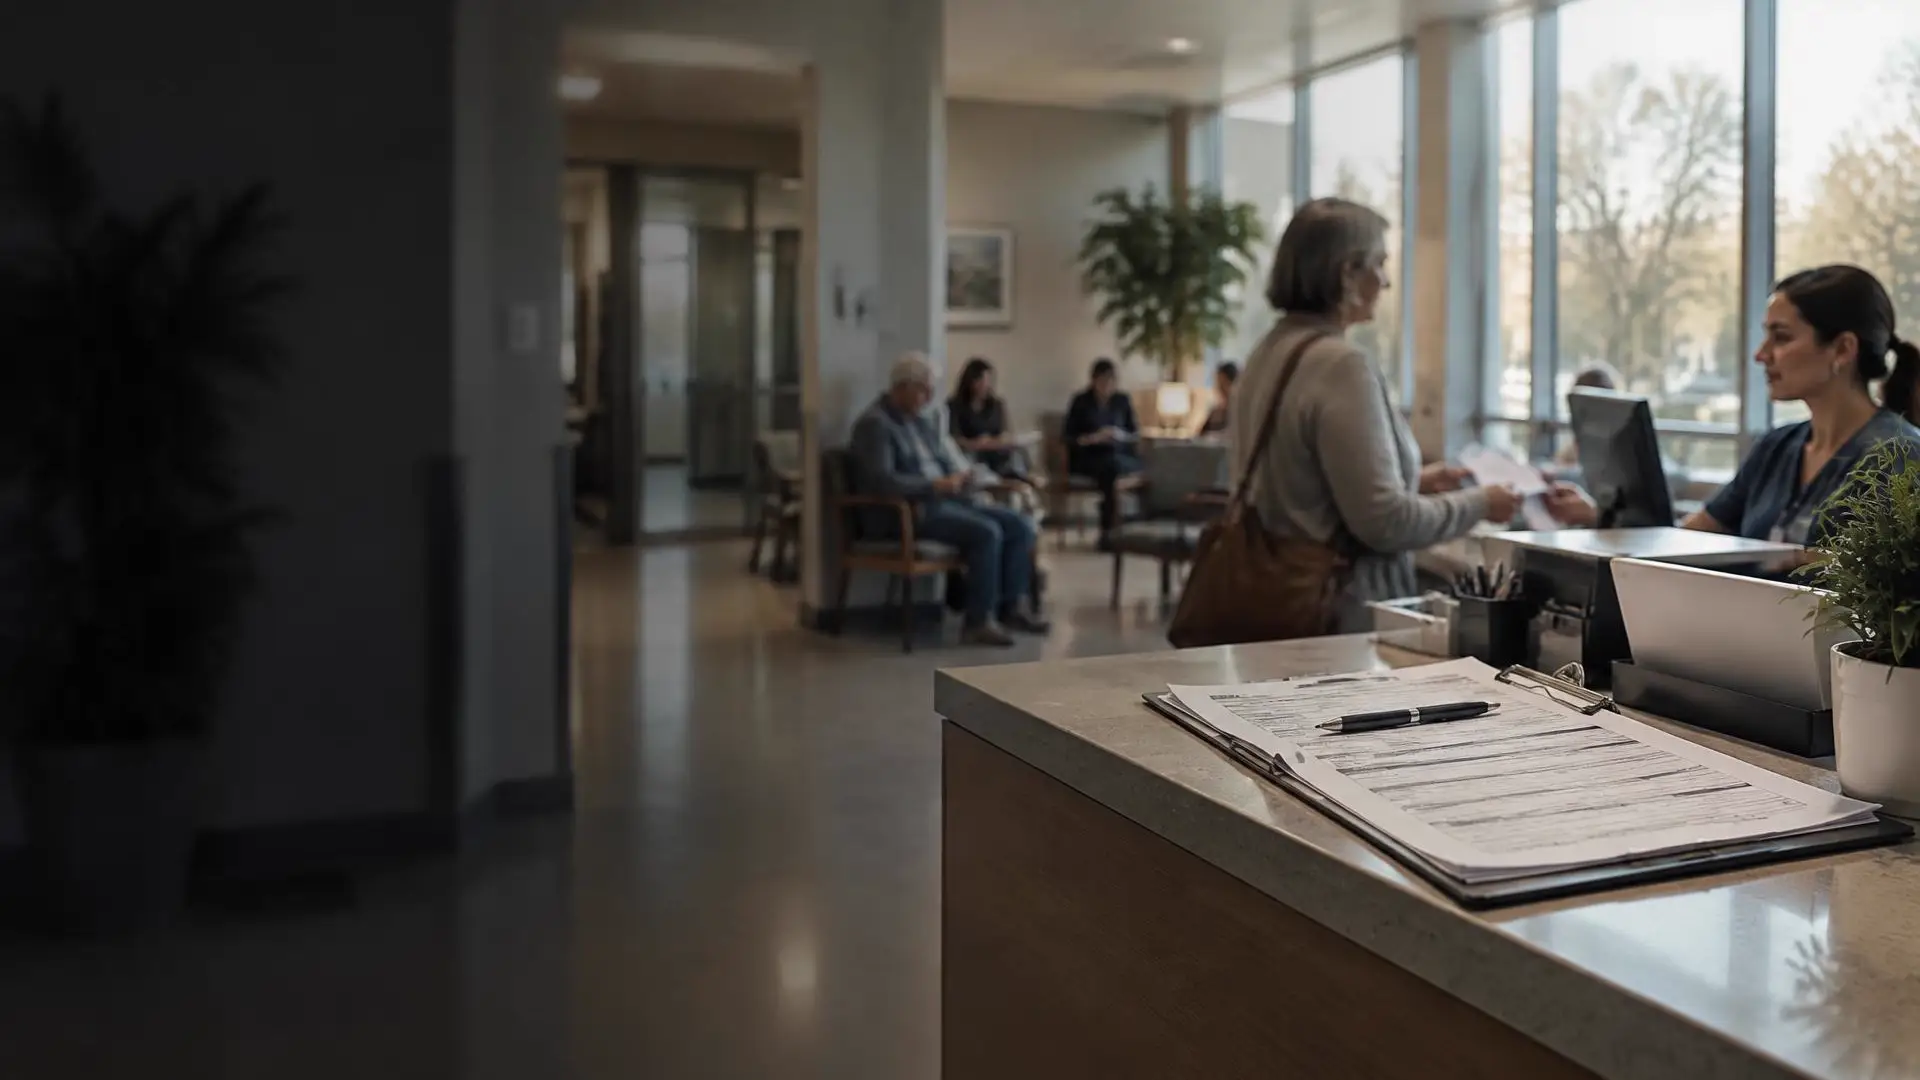
Addiction Treatment & Insurance Access in America: A State-by-State Analysis
A 2024 facility-level analysis of how U.S. substance use treatment facilities report participating with private insurance, Medicaid, and Medicare — and how participation differs by service type and state.
Research & analysis by Treatment Locators · Published September 10, 2026 · Source: SAMHSA 2024 N-SUMHSS facility-level public-use file · Methodology & sources
78.3%
Report participating with private insurance
12,494 of 15,953 facilities
77.8%
Report participating with Medicaid
12,418 of 15,953 facilities
52.6%
Report participating with Medicare
8,397 of 15,953 facilities
Payer participation reflects what facilities reported to SAMHSA. It does not guarantee coverage for a specific plan, network status, authorization, admission, or treatment availability.
Data analysis by Treatment Locators · Reviewed for clinical accuracy by Cole Timonere
Section 1 · National overview
National averages hide major differences by treatment service
Across 15,953 substance use treatment facilities in SAMHSA's 2024 analytic universe, 78.3% reported participating with private insurance, 77.8% with Medicaid, and 52.6% with Medicare. Those national figures change substantially when the data are broken out by treatment service.
Reported payer participation, all substance use treatment facilities
Of 15,953 substance use treatment facilities, 12,494 (78.3%) reported participating with private insurance, 12,418 (77.8%) with Medicaid, and 8,397 (52.6%) with Medicare.
All substance use treatment facilities (2024 analytic universe)
Facilities (N) = 15,953
Private insurance78.3%(12,494)
Medicaid77.8%(12,418)
Medicare52.6%(8,397)
Reading this chart
At the national level, reported private-insurance and Medicaid participation look broadly similar. Medicare stands out immediately: just over half of facilities reported participating with it, roughly 25 percentage points below the other two categories.
What it means
Even that national difference understates how wide the Medicare gap becomes in particular treatment settings.
When facilities are separated by the services they actually provide, the payer picture changes substantially — which is why the sections below are reported service by service rather than as a single nationwide statistic.
Section 2 · Residential treatment
Medicare participation is especially low across residential treatment services
Only 21% of residential withdrawal-management facilities, 23.9% of short-term residential facilities, and 23.5% of long-term residential facilities reported participating with Medicare. Private-insurance participation was substantially higher in each of the three validated residential service categories.
Validated residential service components
Each bar uses its own denominator. Broad “any residential” rates are not shown — see methodology.
Private insurance
Medicaid
Medicare
Across the three validated residential service components, reported Medicare participation remains near one-quarter or lower, while reported private-insurance participation ranges from about 64 to 87 percent.
Residential withdrawal management
Facilities (N) = 1,317
Private insurance87.2%(1,149)
Medicaid53.2%(701)
Medicare21.0%(276)
Residential short-term treatment (≤30 days)
Facilities (N) = 2,460
Private insurance78.9%(1,942)
Medicaid62.0%(1,526)
Medicare23.9%(587)
Residential long-term treatment (>30 days)
Facilities (N) = 2,732
Private insurance63.9%(1,746)
Medicaid61.9%(1,690)
Medicare23.5%(643)
Reading this chart
Across all three validated residential service categories, fewer than one in four facilities reported Medicare participation. That consistency is notable: the pattern is not confined to a single residential service, but holds across withdrawal management, short-term residential treatment, and long-term residential treatment.
What it means
This does not mean Medicare beneficiaries cannot obtain residential addiction treatment.
It does mean the pool of facilities reporting Medicare participation is substantially smaller than the pool reporting private-insurance participation in these categories.
Section 3 · Withdrawal management by setting
Withdrawal-management participation depends heavily on the setting
Among facilities providing withdrawal management, reported Medicare participation ranged from 70.6% in outpatient settings to 55.4% in hospital inpatient settings and 21% in residential settings. Medicaid participation showed a similar, though less dramatic, decline across those settings.
Withdrawal management, by setting
These three settings are reported separately and are not averaged together.
Private insurance
Medicaid
Medicare
Reported payer participation among withdrawal-management facilities differs sharply by setting: outpatient, residential, and hospital inpatient settings each carry their own denominator and their own participation pattern.
Outpatient withdrawal management
Facilities (N) = 1,579
Private insurance86.3%(1,362)
Medicaid79.3%(1,252)
Medicare70.6%(1,115)
Residential withdrawal management
Facilities (N) = 1,317
Private insurance87.2%(1,149)
Medicaid53.2%(701)
Medicare21.0%(276)
Hospital inpatient withdrawal management
Facilities (N) = 784
Private insurance93.4%(732)
Medicaid67.6%(530)
Medicare55.4%(434)
Reading this chart
The same broad treatment need produces very different payer-participation patterns depending on where the care is delivered. For Medicare, reported participation falls from 70.6% in outpatient withdrawal management to 55.4% in hospital inpatient settings and 21% in residential settings — a difference of 49.6 percentage points between the outpatient and residential categories.
What it means
Treatment Locators also examined facilities reporting at least one of those three validated settings.
After removing facilities appearing in more than one category, the analysis identified 3,086 unique facilities, of which 87.9% reported participating with private insurance, 69.5% with Medicaid, and 52.6% with Medicare. That deduplicated view still shows a substantial private-versus-Medicare difference, but the setting-level figures remain the more informative comparison.
Section 4 · Opioid treatment programs
OTPs look very different from residential care
Among 2,224 SAMHSA-certified opioid treatment programs, 81.5% reported participating with private insurance, 87.1% with Medicaid, and 80.1% with Medicare. That comparatively balanced payer pattern is a reminder that insurance participation cannot be generalized across treatment modalities.
SAMHSA-certified opioid treatment programs
Certified OTPs only (OTXFEDOTP = 1).
Private insurance
Medicaid
Medicare
Among 2,224 certified opioid treatment programs, reported participation was 81.5% private insurance, 87.1% Medicaid, and 80.1% Medicare.
SAMHSA-certified opioid treatment programs
Facilities (N) = 2,224
Private insurance81.5%(1,812)
Medicaid87.1%(1,937)
Medicare80.1%(1,781)
Reading this chart
Medicaid participation was actually the highest of the three payer categories here, and reported Medicare participation among OTPs was nearly four times the rate observed among residential withdrawal-management facilities.
OTP certification and reported payer participation do not guarantee coverage for a specific medication, admission, or network status with any particular plan.
What it means
That contrast matters. It suggests payer participation is not simply a function of whether treatment addresses substance use — it is strongly associated with the type of treatment service being delivered.
Section 5 · Two national spotlights
One service with a wide payer split, and one without
Day treatment and partial hospitalization show one of the widest private-versus-Medicare differences in the file. Regular outpatient treatment shows private and Medicaid participation running nearly level.
Day treatment / partial hospitalization
Difference between reported private-insurance and Medicare participation: 53.9 percentage points.
Private insurance
Medicaid
Medicare
Among 2,389 day treatment or partial hospitalization facilities, reported participation was 90.7% private insurance, 65% Medicaid, and 36.8% Medicare.
Day treatment / partial hospitalization
Facilities (N) = 2,389
Private insurance90.7%(2,166)
Medicaid65.0%(1,554)
Medicare36.8%(879)
Regular outpatient treatment
The largest service category in the file, and the most evenly balanced between private insurance and Medicaid.
Private insurance
Medicaid
Medicare
Among 12,307 regular outpatient facilities, reported participation was 80.1% private insurance, 81% Medicaid, and 57% Medicare.
Regular outpatient treatment
Facilities (N) = 12,307
Private insurance80.1%(9,856)
Medicaid81.0%(9,968)
Medicare57.0%(7,015)
90.2 pts
One of the widest headline-eligible state/service splits in the analysis: 97.8% of Florida’s 92 residential withdrawal-management facilities reported participating with private insurance, against 7.6% reporting Medicare. Reported participation is not coverage, network status, or admission.
Section 6 · Interactive state explorer
State patterns can be even more pronounced
Use the map and table to compare facility-reported payer participation by state and treatment service. State percentages should always be read alongside the number of facilities in the selected service category.
80–100%
60–79.9%
40–59.9%
20–39.9%
Under 20%
No facilities in this service
Facility-reported private insurance participation among residential withdrawal management facilities, by state.
Payer N
Publication tier
Florida
97.8%
90
92
Headline eligible
Texas
93.3%
56
60
Headline eligible
New York
90.0%
45
50
Headline eligible
Pennsylvania
88.1%
52
59
Headline eligible
California
87.6%
298
340
Headline eligible
Illinois
96.7%
29
30
Usable with N shown
Indiana
91.4%
32
35
Usable with N shown
Ohio
89.4%
42
47
Usable with N shown
Kentucky
87.5%
28
32
Usable with N shown
Maryland
83.7%
36
43
Usable with N shown
Michigan
73.3%
22
30
Usable with N shown
Georgia
71.9%
23
32
Usable with N shown
Tennessee
67.7%
21
31
Usable with N shown
Nevada
100.0%
10
10
Directional only
Wisconsin
100.0%
10
10
Directional only
Utah
96.6%
28
29
Directional only
Massachusetts
95.0%
19
20
Directional only
Virginia
94.1%
16
17
Directional only
Oregon
93.8%
15
16
Directional only
Missouri
93.3%
14
15
Directional only
Minnesota
92.9%
13
14
Directional only
New Jersey
92.9%
26
28
Directional only
Wyoming
91.7%
11
12
Directional only
Washington
91.3%
21
23
Directional only
West Virginia
90.9%
10
11
Directional only
Kansas
88.2%
15
17
Directional only
Arizona
83.3%
15
18
Directional only
Louisiana
81.8%
18
22
Directional only
North Dakota
81.8%
9
11
Directional only
Colorado
73.1%
19
26
Directional only
North Carolina
66.7%
16
24
Directional only
Mississippi
53.8%
7
13
Directional only
Alabama
100.0%
2
2
Small N — not ranked
Alaska
100.0%
1
1
Small N — not ranked
Arkansas
100.0%
9
9
Small N — not ranked
Connecticut
100.0%
6
6
Small N — not ranked
Delaware
100.0%
1
1
Small N — not ranked
Iowa
100.0%
9
9
Small N — not ranked
Maine
100.0%
4
4
Small N — not ranked
Montana
100.0%
5
5
Small N — not ranked
Nebraska
100.0%
8
8
Small N — not ranked
New Hampshire
100.0%
6
6
Small N — not ranked
Rhode Island
100.0%
2
2
Small N — not ranked
South Carolina
100.0%
5
5
Small N — not ranked
Idaho
87.5%
7
8
Small N — not ranked
Hawaii
83.3%
5
6
Small N — not ranked
New Mexico
66.7%
6
9
Small N — not ranked
South Dakota
60.0%
3
5
Small N — not ranked
Oklahoma
40.0%
2
5
Small N — not ranked
State results include facility counts. Smaller groups should be interpreted cautiously, and groups with fewer than 10 facilities are excluded from comparative rankings. The full tier thresholds are described in the methodology below.
Section 7 · State case studies
Four states where the service-level split is stark
Every figure below applies only to the named service category in that state — not to all treatment facilities there.
Florida
Residential withdrawal management
Facilities (N) = 92 in this service category
Private
97.8%
90 facilities
Medicaid
28.3%
26 facilities
Medicare
7.6%
7 facilities
In Florida, 97.8% of 92 residential withdrawal-management facilities reported participating with private insurance, compared with 28.3% for Medicaid and 7.6% for Medicare — a private-to-Medicare difference of 90.2 percentage points within this service category.
California
Day treatment / partial hospitalization
Facilities (N) = 292 in this service category
Private
96.6%
282 facilities
Medicaid
21.2%
62 facilities
Medicare
18.2%
53 facilities
California shows a repeated service-specific pattern. Among day treatment and partial hospitalization facilities, 96.6% reported private-insurance participation versus 21.2% Medicaid and 18.2% Medicare. Among 537 short-term residential facilities, the figures were 76.4%, 27.9%, and 11.5%, respectively.
Texas
Residential withdrawal management
Facilities (N) = 60 in this service category
Private
93.3%
56 facilities
Medicaid
43.3%
26 facilities
Medicare
11.7%
7 facilities
In Texas, reported Medicare participation was 11.7% among 60 residential withdrawal-management facilities and 5.3% among 76 long-term residential facilities. Each figure describes only that service category.
Ohio
Opioid treatment programs
Facilities (N) = 131 in this service category
Private
93.9%
123 facilities
Medicaid
98.5%
129 facilities
Medicare
93.9%
123 facilities
Ohio’s OTPs offer a counterexample: among 131 certified programs, 93.9% reported private-insurance participation, 98.5% Medicaid participation, and 93.9% Medicare participation.
Section 8 · Patient-side context
Facility participation is only one side of treatment access
Among the specific 2024 NSDUH adult population with an unmet perceived need for substance use treatment, cost and coverage were commonly reported reasons for not receiving it. These figures describe that population only — not all U.S. adults, and not the facilities analyzed above.
Cost was a barrier
42.3%
No insurance coverage
30.1%
Insurance did not pay enough for treatment
24.6%
Source: SAMHSA 2024 National Survey on Drug Use and Health detailed tables. Used here as patient-reported context only; it is a separate survey from the facility file and the two cannot be combined.
Findings
What this analysis shows
The clearest conclusion from the 2024 data is not that one payer universally provides better or worse addiction-treatment access — it is that payer participation varies dramatically across treatment services and locations.
Reported private-insurance and Medicaid participation are relatively similar nationally, while Medicare participation is considerably lower.
Medicare participation is particularly limited across residential categories.
Withdrawal-management participation differs substantially between outpatient, residential, and hospital inpatient settings.
Opioid treatment programs report comparatively high participation across all three payer categories.
Some states show extremely large payer-participation differences within particular treatment services.
What these numbers do not mean
They do not confirm that a particular insurance plan is accepted.
They do not verify whether a facility is currently in network.
They do not determine whether an individual is eligible for coverage.
They do not establish whether a service will be authorized or considered medically necessary.
They do not indicate current openings or bed availability, or guarantee admission.
Benefits and coverage should be verified directly with the insurer and the treatment provider.
Methodology
How we calculated this
Every facility-level finding on this page is reproducible from SAMHSA's 2024 public-use data and published tables.
Republish this analysis
Charts, figures, and datasets on this page are published under a Creative Commons Attribution 4.0 licence. Attribute Treatment Locators and link to this page.
Treatment Locators. “Addiction Treatment & Insurance Access in America: A State-by-State Analysis.” Analysis of SAMHSA 2024 N-SUMHSS public-use data. https://treatmentlocators.com/research/insurance-access
Medically reviewed by Cole Timonere, PhD, JD, LMHC, LPCC
Licensed mental health and clinical counselor with doctoral and legal training, specializing in substance use disorders, withdrawal management, and behavioral health care. Reviews the clinical accuracy of the treatment guides on this site.
Editorial content — always confirm clinical details with a licensed provider.
Questions
Frequently asked questions
Explore the treatment directory
Treatment Locators publishes SAMHSA-listed facilities by state and city, alongside plain guides to levels of care and how treatment is paid for. Listings reflect what facilities report to SAMHSA and do not confirm coverage, network status, or availability.